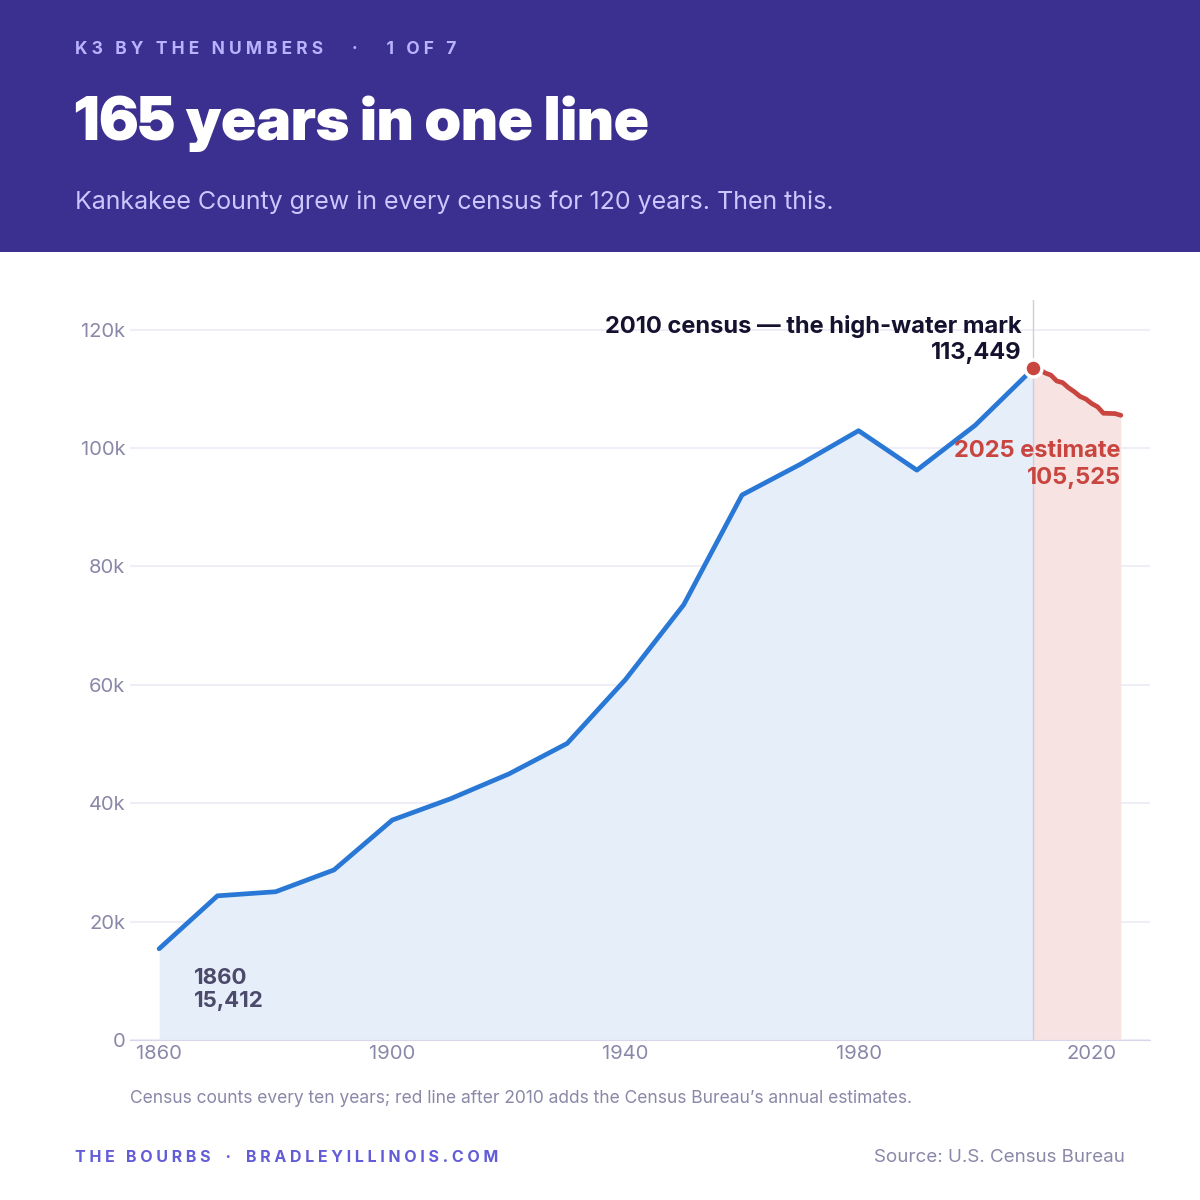
Kankakee County had 105,525 residents on July 1, 2025.
That is 2,123 fewer than the Census Bureau's April 2020 starting point, a 2.0% drop in five years. (The 2020 census counted 107,502. The Bureau's starting figure, 107,648, adds its later corrections to that count, and it is what the Bureau measures change from.) The county is also 7,924 people below its all-time high of 113,449, set in the 2010 census.
And the slide is not new. By the Bureau's current annual estimates, the county has never been above its 2010 count. Every July estimate from 2011 through 2025 came in lower than the year before: fifteen straight years down. The county is now smaller than at any point since 2002.
That is the longest decline on record. The 1980s were the only other decade in which the county lost people. The annual estimates show eight straight years down then, 1981 through 1988, before the county turned back up in 1989. That decade gave back 6,671 people and then recovered them. This decline has not reversed.
We pulled the raw federal files rather than the press release: the Vintage 2025 population estimates, the 2010–2020 revised annual estimates, the 2020 census redistricting file, five census volumes going back to a 1920 bulletin, and the American Community Survey. Then we put all 21 municipalities and all 17 townships on one page.
Here is what it says.
1. Kankakee is a quarter smaller than it was in 1970
The city of Kankakee peaked in 1970 at 30,944 people. The 2025 estimate is 23,400.
That is a loss of 7,544 residents, 24.4% of the city, over 55 years. No other municipality in the county has lost anywhere near that many people. A few tiny villages have fallen further in percentage terms (Union Hill went from 138 people in 1950 to 49 today), but those losses are dozens of people, not thousands.
The city has shrunk in every census since 1970 but one: between 2000 and 2010 it was essentially flat, gaining 46 people. Then it lost 3,485 people between 2010 and 2020, its worst decade on record.
Put plainly: for every four people who lived in Kankakee in 1970, three live there now.
2. Bourbonnais went from 611 people to 17,658
In 1910, Bourbonnais was a village of 611 people. Kankakee was 22.9 times its size.
Today Bourbonnais has 17,658 and Kankakee has 23,400. Kankakee is now just 1.3 times the size of Bourbonnais.
The break happened in one decade. Between 1970 and 1980, Bourbonnais went from 5,909 to 13,280, growing 125% in ten years and passing Bradley along the way. That gain of 7,371 people is the largest ten-year gain any town in the county has ever posted. The census counts don't record why it happened then.
The village had been changing for a while before that. In 1940, Olivet Nazarene University (ONU), the private university in the village, moved to Bourbonnais from Olivet, Illinois, after a 1939 fire destroyed the main building on its old campus. It took over the former St. Viator College campus.
Bradley grew the same way, only more slowly: 9,881 people in 1970, 15,895 by 2010.
3. One township accounts for 61% of the county's growth since 1930
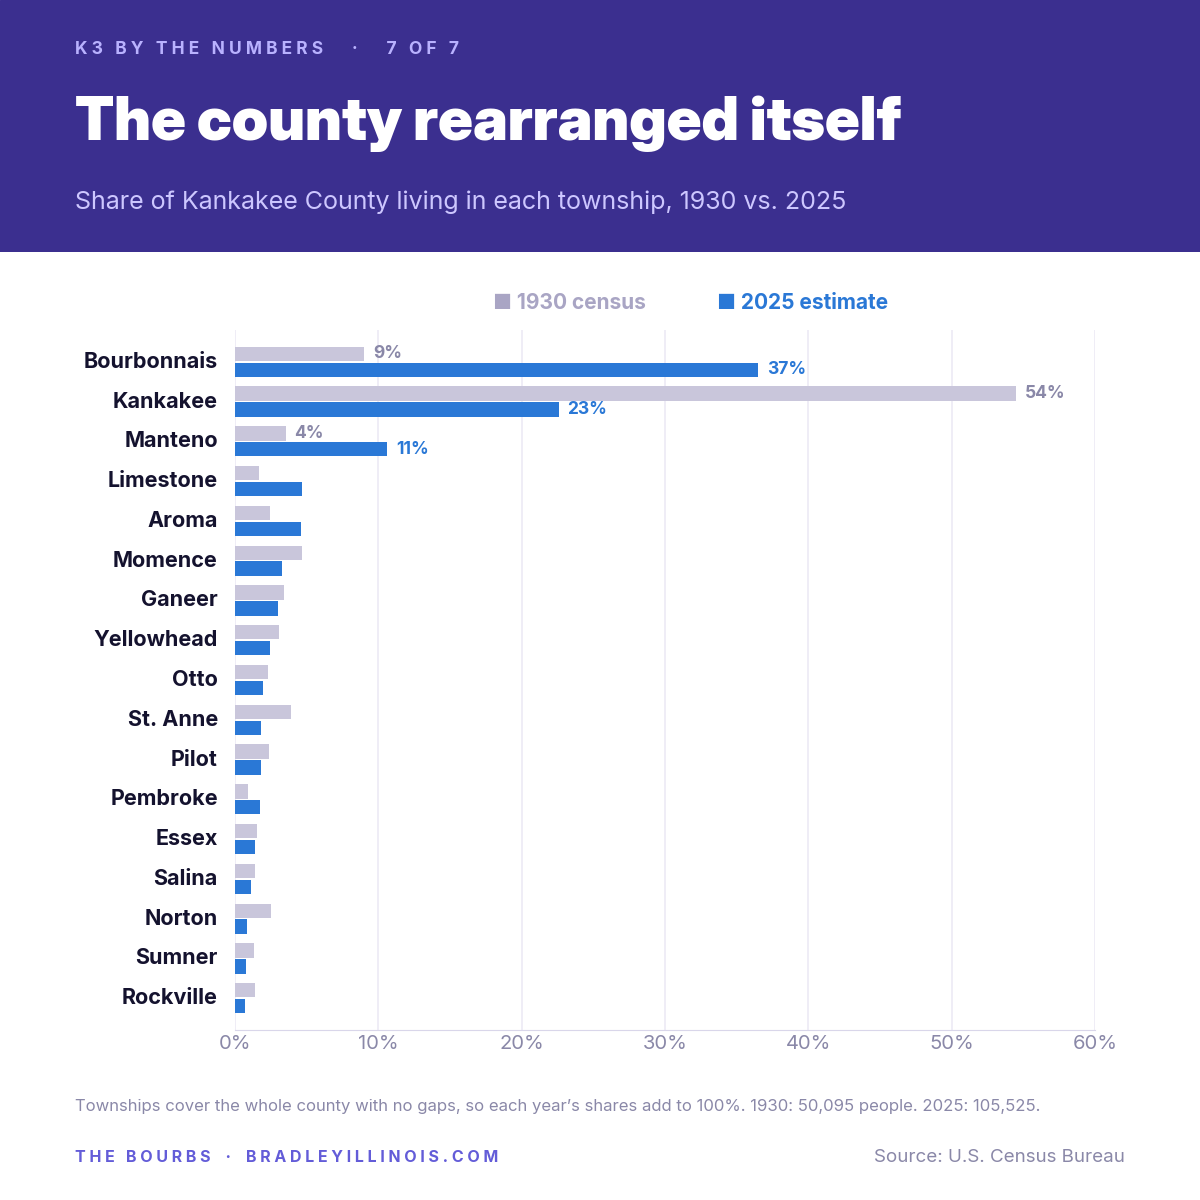
Townships are the honest unit here. Municipalities cover only part of the county, and their boundaries move with every annexation. Townships cover the whole county with no gaps and no overlaps. Their numbers add up exactly to the county total in every census since 1930, and in every estimate year.
In 1930, Kankakee township held 27,289 people, 54% of everyone in Kankakee County. Bourbonnais township held 4,519, or 9%.
By the 2025 estimate, Bourbonnais township holds 38,541, or 37% of the county. Kankakee township holds 23,835 (23%), which is 3,454 fewer people than it had in 1930.
The county added 55,430 people between 1930 and 2025, and Bourbonnais township alone accounts for 34,022 of them. The county's center of gravity moved north.
Those same two townships are also where most of the recent decline is happening. Since April 2020, Bourbonnais township is down 705 people and Kankakee township is down 694. Together that is two-thirds of the county's entire loss. Only two of the 17 townships have gained people since 2020: Pembroke (+16) and Essex (+1).
One footnote worth knowing, because it is the strangest line in the whole dataset. Manteno township held 1,781 people in 1930 and 7,834 in 1940, quadrupling in ten years. It reached 11,083 in 1960, then fell to 8,159 by 1970.
That swing wasn't new housing. It was Manteno State Hospital, the state psychiatric institution in rural Manteno Township, which took its first patients in December 1930 and closed on December 31, 1985. Its patient population peaked at 8,195 in 1954, and the census counted those patients where they lived. Meanwhile the village of Manteno, a couple of miles from the hospital grounds, grew in every census from 1930 through 1990. The township's drop in the 1960s came entirely outside the village, which is where the hospital was.
4. Only three towns are bigger than they were in 2020, and one of them barely
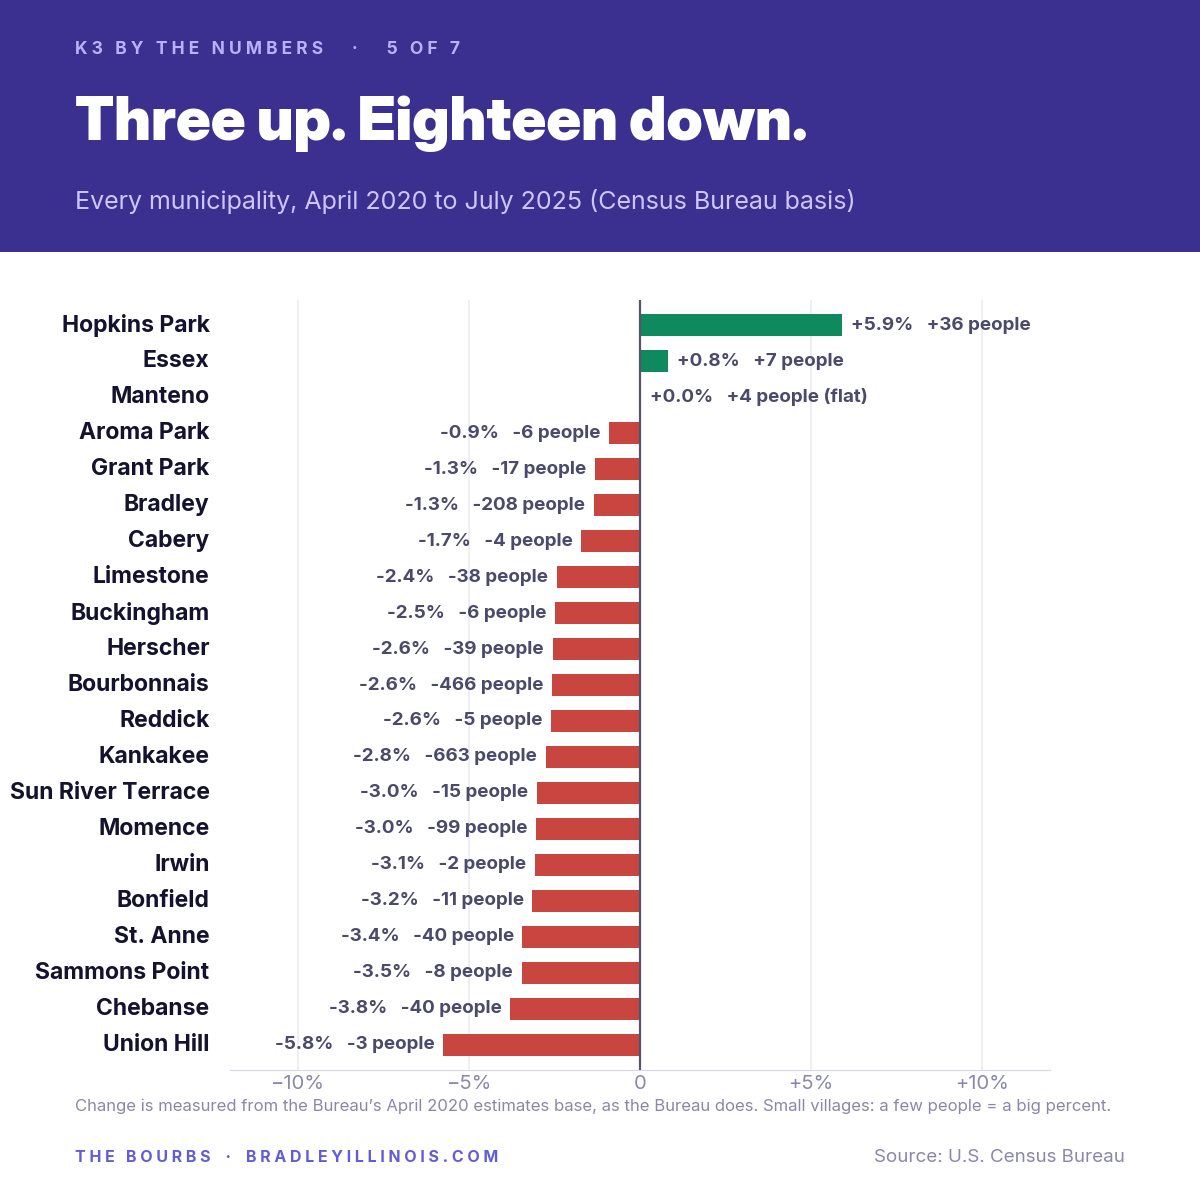
The Census Bureau measures change since 2020 from its April 2020 starting point, not from the raw census count. The starting point includes the Bureau's later corrections and boundary updates, and it is what every new estimate is built on. Measured that way, three municipalities have gained people and eighteen have lost them.
Up: Hopkins Park (+36 people, +5.9%), Essex (+7, +0.8%) and Manteno (+4, which is flat).
Down the most, by percentage: Union Hill (−5.8%), Chebanse (−3.8%), Sammons Point (−3.5%), St. Anne (−3.4%) and Bonfield (−3.2%).
Three cautions:
- These are small places. Union Hill's 5.8% is three people.
- These are modeled estimates, not counts. A village moving a dozen people in five years is inside the noise.
- The measuring point matters. For a few towns the Bureau's starting point differs from the census count by enough to flip the answer. Momence was counted at 3,117 in 2020, but the Bureau's starting figure is 3,257. Compared with the raw count, Momence looks like it grew. Measured the Bureau's way, it lost 99 people. Sun River Terrace and Sammons Point work the same way.
Hopkins Park is the one real gainer, and its gain is recent. The village slipped a few people a year through 2023, then added 26 in 2024 and 20 in 2025. That is worth watching, because the long view there is rough: Pembroke Township peaked at 4,693 people in 1980 and is down to an estimated 1,856.
Manteno is the other notable result. It is flat: 9,197 at the Bureau's April 2020 starting point, 9,201 now. In a county where almost everything is sliding, flat stands out. Manteno is also the county's modern growth story. It had 3,488 people in 1990 and 9,210 in 2020, more than two and a half times as many in thirty years.
The county's two biggest towns are down by similar amounts: Kankakee −2.8% (−663 people) and Bourbonnais −2.6% (−466).
5. The county is shrinking for two reasons, and neither is the one people name
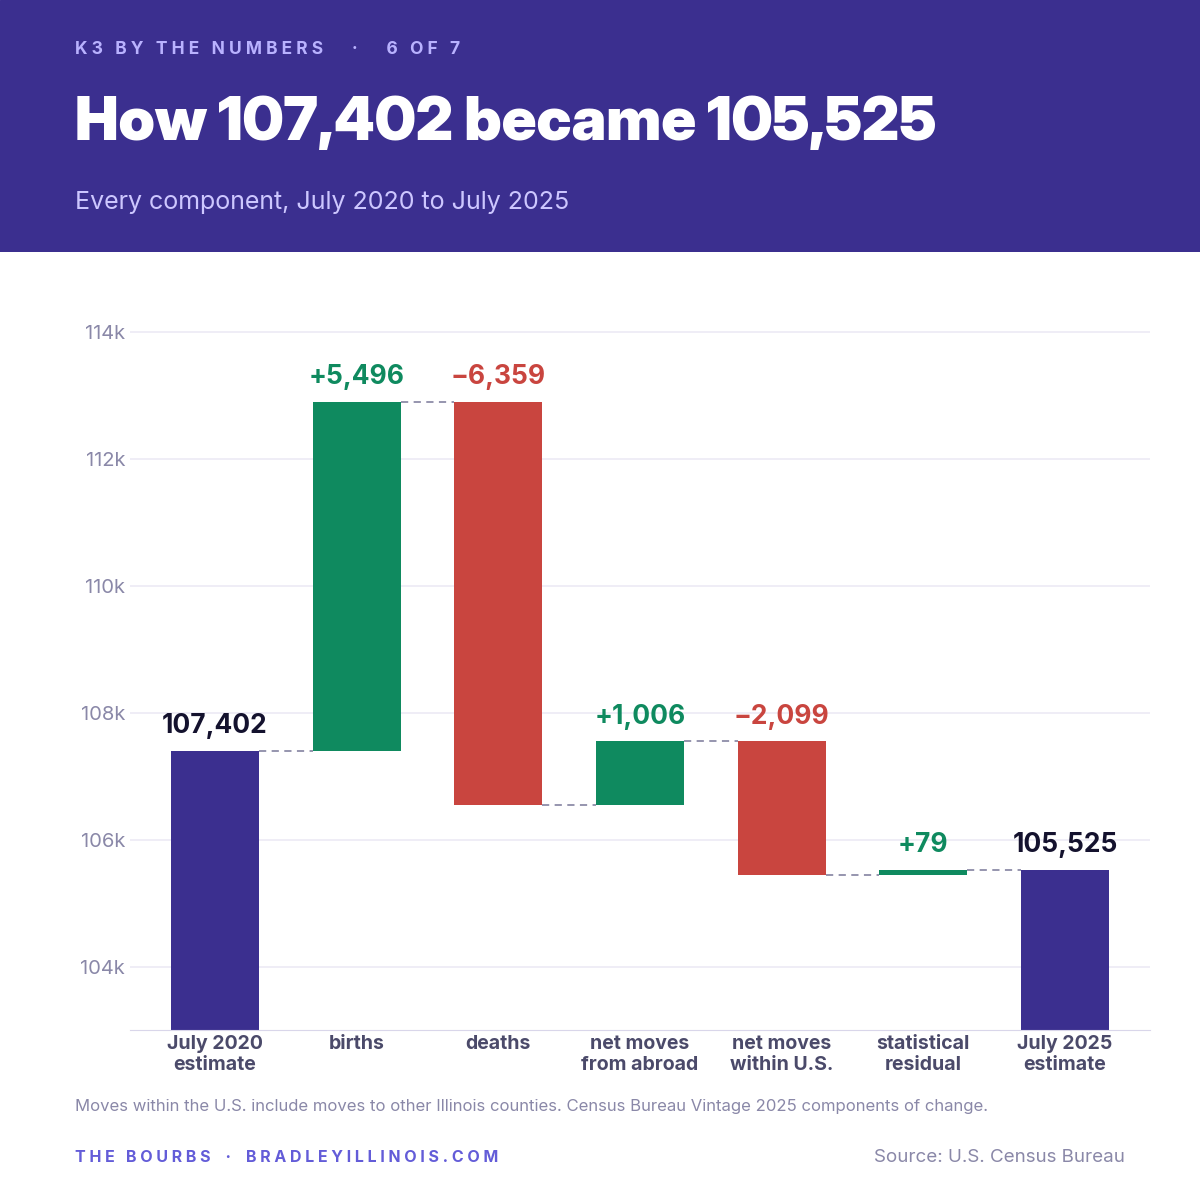
Population change has exactly three inputs: births, deaths, and people moving. The Census Bureau publishes all three.
More residents die here than are born here. That has been true in each of the last five years: 5,496 births against 6,359 deaths, a natural loss of 863 people. This is new. Illinois Department of Public Health records show more births than deaths in the county in every year from 2010 through 2019. The year 2020 was the first in which deaths outnumbered births.
More people move away than move in, within the U.S. Net domestic migration, which counts moves to and from other Illinois counties as well as other states, ran −2,099 over five years. The worst single year was 2022, at −1,035. This is the largest single drag on the county, bigger than the gap between births and deaths.
International arrivals are the only line that adds. Net international migration was +1,006 over the same five years, and it was positive in every one of them. It cancels out about half the domestic loss. Without it, the county would have lost about half again as many people: roughly 2,900 over those five years instead of about 1,900.
6. We are middle of the pack, right on the seam
Against 30 neighboring and peer counties, Kankakee County ranks 23rd of 31 for growth since 2020, at −2.0%.
Of the seven counties that touch ours, the four to the north and east are all growing. To the north are Will (+2.1%) and Grundy (+2.8%). To the east, across the Indiana line, are Lake (+1.2%) and Newton (+2.6%). The three to the south and west are shrinking faster than we are: Livingston (−2.2%), Ford (−2.3%) and Iroquois (−3.4%).
Most of the Chicago collar counties are growing: Kendall +10.3%, McHenry +2.4%, Will +2.1%, Kane +1.8%. Lake (+0.7%) and DuPage (+0.1%) are roughly flat, and Cook County is down 1.6%.
The downstate picture is mixed. Champaign is up 1.7%. Peoria is down 1.9%, Vermilion 4.0% and Macon 4.5%.
7. The money picture
| Kankakee Co. | Illinois | U.S. | |
|---|---|---|---|
| Median household income | $71,281 | $83,390 | $80,734 |
| Median home value | $192,600 | $263,300 | $332,700 |
| Median gross rent | $1,097 | $1,274 | $1,413 |
| Bachelor's degree or higher | 21.2% | 37.8% | 35.7% |
| Poverty rate | 12.2% | 11.8% | 12.5% |
| Homeownership | 69.9% | 67.1% | 65.2% |
American Community Survey, 2020–2024 five-year estimates.
The county earns about 85 cents on the Illinois dollar, and its homes cost about 73 cents on the Illinois dollar, so housing here is cheaper relative to income than it is statewide. On the ACS measure, poverty is close to the state rate.
The real gap is education. Here, 21.2% of adults hold a bachelor's degree, against 37.8% statewide. That gap of more than 16 points is one of the widest differences from Illinois in the data. Only the share of residents born abroad is further off in proportion: 5.7% here, 14.7% statewide.
Within the county the spread is enormous. Among the ten towns with more than 1,000 residents, median household income runs from $103,906 in Limestone to $47,514 in the city of Kankakee. In the smaller villages, where the survey estimates are much rougher, it goes as low as $30,660 in Hopkins Park, the village in Pembroke Township, an area with a long history of deep poverty. The poverty rate there is 30.6%. Hopkins Park is also the one town in the county with a clear population gain since 2020.
About these numbers
Two different kinds of figure appear above, and the difference matters.
Census counts, taken every ten years through 2020, are an attempt to count every resident. They are what redistricting and most funding formulas use.
Population estimates are modeled each year from births, deaths, tax records, Medicare enrollment and housing permits. They are the best current figures available, and each new release revises the last. Every estimate since 2020 is built on the Bureau's April 2020 starting point, not the raw count, so that is what we measure change from. The 2011–2019 figures are the Bureau's revised (intercensal) estimates, released in 2024. They replaced an older series that had the county peaking in 2011. Treat small annual moves in small towns with skepticism.
Everything here comes from published U.S. Census Bureau data, plus Illinois Department of Public Health birth and death records for the pre-2020 comparison. Nothing is interpolated or projected by us. The full source list, including the places where the government's own publications disagree with each other, is on the data page.
One of those disagreements is ours to report. The 2010 federal report Population and Housing Unit Counts: Illinois prints Ganeer township's 1990 population as 2,146. The 1990 edition prints 3,146, and only 3,146 makes the report's 1990 township figures add up to the 96,255 county total it prints on the same page. We used 3,146.
We also left some things out rather than publish them unverified:
- Township figures for 1910 and 1920. Our readings of those two pages came up 60 and 399 people short of the published county totals, and we could not close the gap.
- Five early town counts. Our readings of these disagree with other published compilations, and we couldn't re-check the original pages: Bradley and Manteno in 1910, Buckingham and Reddick in 1920, and Hopkins Park in 1980.
Both are listed on the data page.
Open the interactive data →: every town, every census, sortable and searchable, with the full sources.
Questions, corrections, or a number you want us to pull? Message The Bourbs+ on Facebook.